Create a new Resource group and then new Log Analytics Workspace
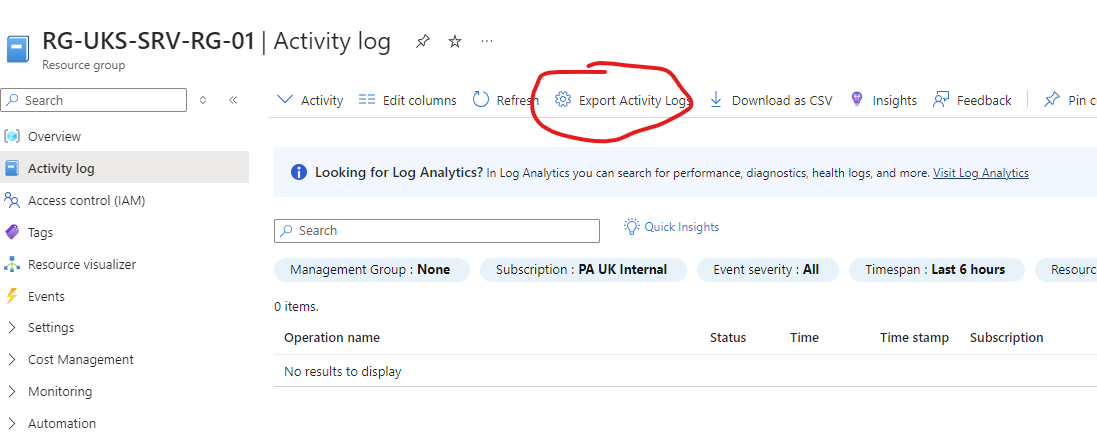
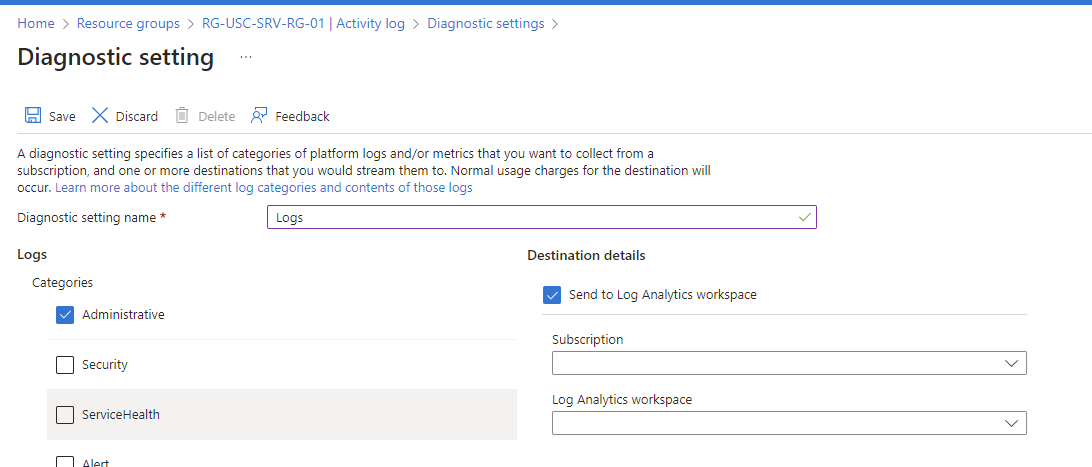
Export the Admin Diagnostics of the Resource group the server sits in to the Log Analytics Workspace you created
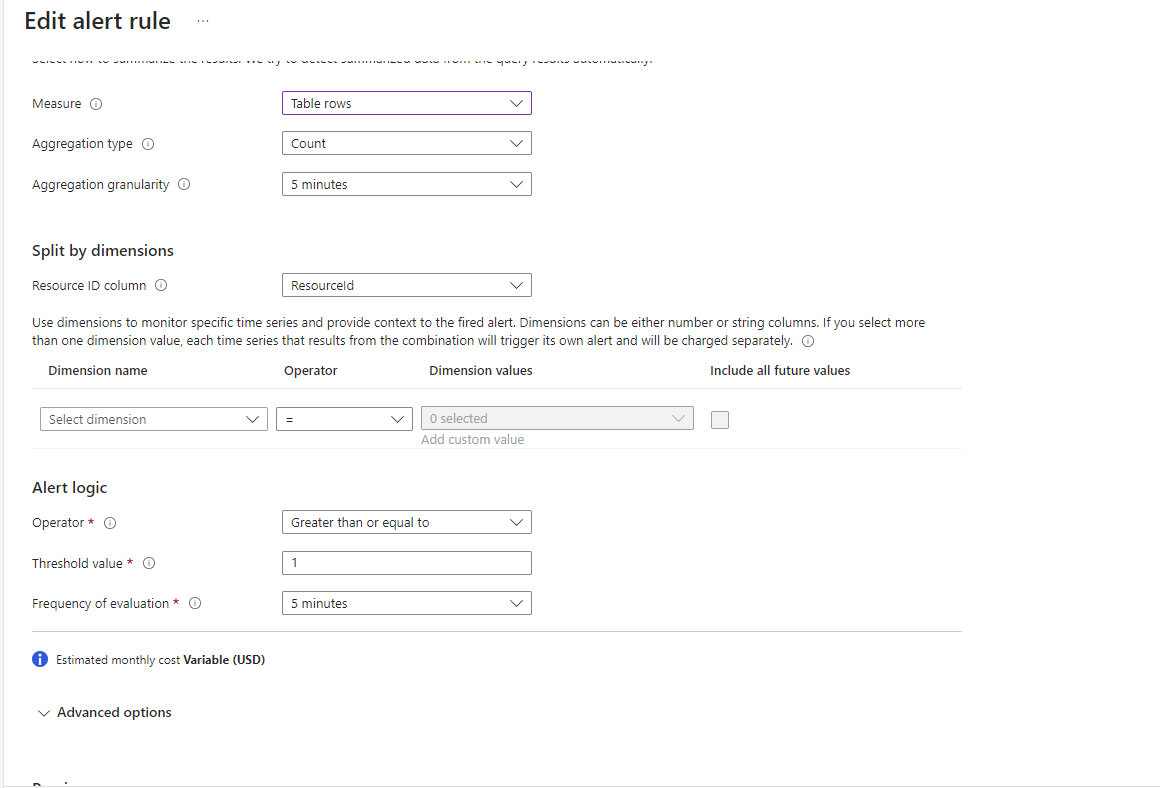
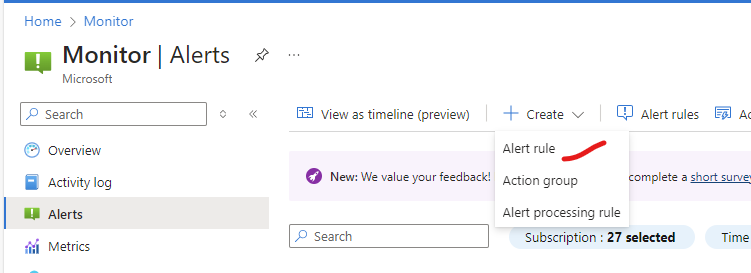
Setup the Alert
Choose the Subscription
let DaysOfLogsToCheck = ago(7days);
let MaxUptime = ago(3d); // If the VM has been up for this long we want to know about it
AzureActivity
| where TimeGenerated > DaysOfLogsToCheck
// ActivityStatus == "Succeeded" makes more sense, but in practice it can be out of order, so "Started" is better in the real world
| where OperationName in ("Deallocate Virtual Machine", "Start Virtual Machine") and ActivityStatus == "Started"
// We need to keep only the most recent entry of type 'Deallocate Virtual Machine' or 'Start Virtual Machine'
| top 1 by TimeGenerated desc
// Check if the most recent entry was "Start Virtual Machine" and is older than MaxUpTime
| where OperationName == "Start Virtual Machine" and TimeGenerated <= MaxUptime
| project TimeGenerated, Resource, OperationName, ActivityStatus, ResourceId