Enabling vCenter Server Data Collection
To enable vCenter Server data collection:
1.Connect to the vCenter Server.
2 In the Administration menu item, selectvCenter Server Settings The vCenter Server Settings dialog is displayed.
3. Select Statistics.
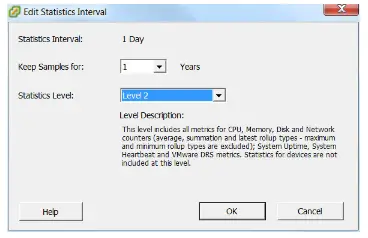
4. Make sure that the Statistics Level value for all interval durations up to and including the one day duration is at least 2. If any of the durations have a value less than 2, do the following, starting with the smallest interval:
a) Select the interval and clickEdit
b) Change Statistics Level to Level 2
c) Click OK
5. Repeat step 4 for all the values up to and including the 1 day interval duration.
6. Click OK and wait for at least a day before using the aggregate usage data. Collecting Data Characteristics for VMs
You can collect data characteristics for the virtual machines in a VPG in one of the following ways:
Via vSphere Client console performance statistics.
By running a script to collect the data characteristics.
Note: The script samples supplied with the download, require vSphere PowerCLI and permissions to access the vCenter Server using the script.
8 By using operating system performance monitors, such as the Microsoft Performance Monitor utility for Windows operating systems or the iostat command for Linux operating systems. Collect data for a minimum of one day. Collecting this information impacts on performance and therefore the collection period should be long enough to gather a true representation of usage but not too long. The first procedure described below, to collect data characteristics for the VMs via the vSphere Client console performance statistics, uses
a timeframe of one day and the second procedure, to collect data characteristics for the VMs by running a scri pt to collect the data characteristics uses a timeframe of seven days.
Note: When running vCenter Server versions before version 5.x, if any of the virtual machines use NFS storage, metrics for the
NFS storage are not generated by the vCenter Server. To collect data characteristics for the VMs via the vSphere Client console performance statistics:
1. In the vSphere Client console select the VM and open the Performance tab.
2. Click Advanced
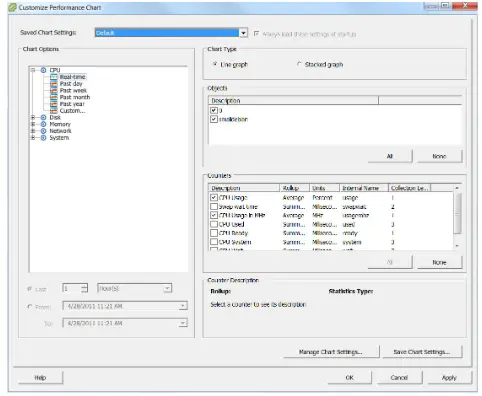
3 . Click the Charts Options link. The Customize Performance Chart dialog is displayed.
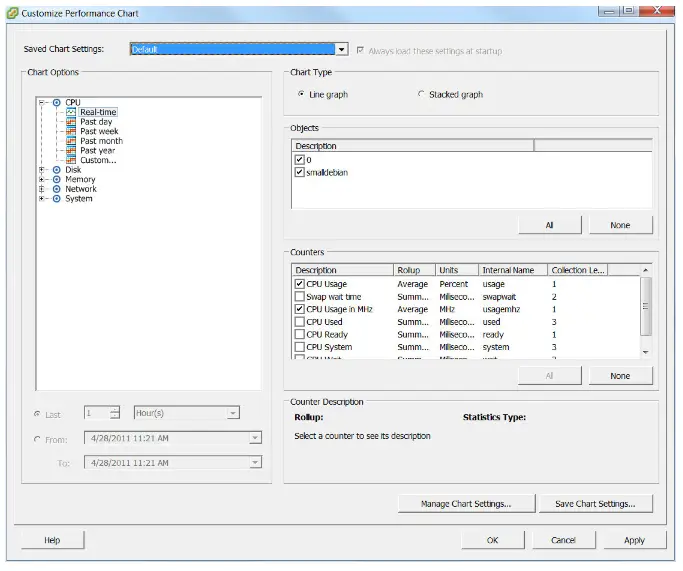
4. In Chart Options , drill-down in Disk and select Past day
5. In Counters , click None to clear all the selections and then select Disk Write Rate or Write Rate
6. Click OK
9 A chart similar to the following is generated:
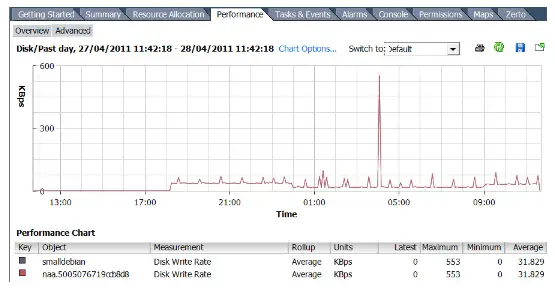
Use the chart for the average write rate of the VM.
To collect data characteristics for the VMs via a script:
Note:
The following script and the samples supplied with the download, require vSphere PowerCLI and permissions to access
the vCenter Server using the script.
Run a script similar to the following:
$report = @()
Get-VM | %{
$stats = Get-Stat -Entity $ -Stat disk.write.average -Start (Get-Date).adddays(-7) –
ErrorAction SilentlyContinue
if($stats){
$statsGrouped = $stats | Group-Object -Property MetricId
$row = “” | Select Name, WriteAvgKBps, WriteAvgMBps
$row.Name = $_.Name
$row.WriteAvgKBps = ($statsGrouped |
where {$_.Name -eq “disk.write.average”} |
%{$_.Group | Measure-Object -Property Value -Average}).Average
$row.WriteAvgMBps = $row.WriteAvgKBps/1024
$row.WriteAvgKBps = “{0:N2}” -f $row.WriteAvgKbps
$row.WriteAvgMBps = “{0:N2}” -f $row.WriteAvgMBps
$report += $row
}
}
$report | Export-Csv “C:\ZertoOutput.csv”
Note: If you want a value other than seven days, change the value of the adddays() function. For example to collect data
for three days, use adddays(-3)
Use the resulting file, C:\ZertoOutput.csv , for the average write rate of the VM.
Note: Versions of this script are included in the download with this document
