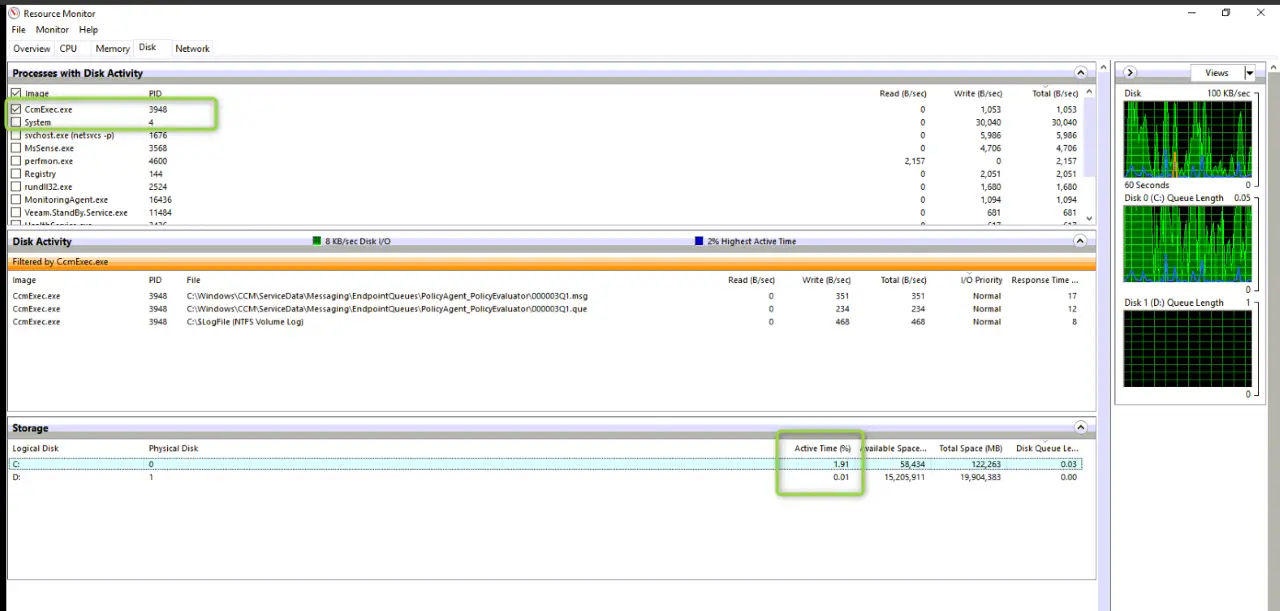
Use case: Backup was running really slowly. Tracking the Veeam backup log it was using a server for the repository. Logging in to the server we checked via Resource Monitor to the Veeamagent.exe (below is a sample screenshot the job isn’t running now), and checked the active time against the write disk which was D:. Active time was showing as 100%.
From there utilising diskspd command we were able to determine the latency on the disk was high.
DiskSpd quick download link: https://aka.ms/getdiskspd
- Command to run: diskspd.exe -c25G -b512K -w100 -Sh -d600 -L D:\testfile.datwhere -w = amount of write performance – i.e. 100 = 100% write, 50 = 50% read + 50% writeD: = the drive to perform the test against
- This will write a file to the disk to perform the tests against
- Below outputs the CPU usage, as well as results for IO. It’s a bit convoluted but check the AvgLat (check NHADR01 much better J )
- Don’t forget to delete the D:\testfile.dat at the test completion
For the server on first run it looked to be 65ms, but re-run showing about 36ms, nominal value should be <15ms.
C:\temp\DiskSpd\x86>diskspd.exe -c25G -b512K -w50 -Sh -d600 -L D:\testfile.dat
Command Line: diskspd.exe -c25G -b512K -w50 -Sh -d600 -L D:\testfile.dat
Input parameters:
timespan: 1
————-
duration: 600s
warm up time: 5s
cool down time: 0s
measuring latency
random seed: 0
path: ‘D:\testfile.dat’
think time: 0ms
burst size: 0
software cache disabled
hardware write cache disabled, writethrough on
performing mix test (read/write ratio: 50/50)
block size: 512KiB
using sequential I/O (stride: 512KiB)
number of outstanding I/O operations per thread: 2
threads per file: 1
using I/O Completion Ports
IO priority: normal
Results for timespan 1:
*******************************************************************************
actual test time: 600.00s
thread count: 1
proc count: 8
CPU | Usage | User | Kernel | Idle
——————————————-
0| 12.68%| 5.39%| 7.29%| 87.32%
1| 16.12%| 8.14%| 7.98%| 83.88%
2| 15.51%| 8.10%| 7.41%| 84.49%
3| 20.18%| 9.90%| 10.28%| 79.82%
4| 20.34%| 8.52%| 11.83%| 79.66%
5| 17.43%| 5.72%| 11.71%| 82.57%
6| 39.53%| 13.31%| 26.23%| 60.47%
7| 53.09%| 26.06%| 27.03%| 46.91%
——————————————-
avg.| 24.36%| 10.64%| 13.72%| 75.64%
Total IO
thread | bytes | I/Os | MiB/s | I/O per s | AvgLat | LatStdDev | file
—————————————————————————————————–
0 | 26373259264 | 50303 | 41.92 | 83.84 | 23.852 | 19.811 | D:\testfile.dat (25GiB)
—————————————————————————————————–
total: 26373259264 | 50303 | 41.92 | 83.84 | 23.852 | 19.811
Read IO
thread | bytes | I/Os | MiB/s | I/O per s | AvgLat | LatStdDev | file
—————————————————————————————————–
0 | 13206814720 | 25190 | 20.99 | 41.98 | 11.030 | 12.632 | D:\testfile.dat (25GiB)
—————————————————————————————————–
total: 13206814720 | 25190 | 20.99 | 41.98 | 11.030 | 12.632
Write IO
thread | bytes | I/Os | MiB/s | I/O per s | AvgLat | LatStdDev | file
—————————————————————————————————–
0 | 13166444544 | 25113 | 20.93 | 41.85 | 36.713 | 17.198 | D:\testfile.dat (25GiB)
—————————————————————————————————–
total: 13166444544 | 25113 | 20.93 | 41.85 | 36.713 | 17.198
total:
%-ile | Read (ms) | Write (ms) | Total (ms)
———————————————-
min | 0.409 | 7.884 | 0.409
25th | 0.862 | 26.752 | 8.213
50th | 8.226 | 33.792 | 24.334
75th | 16.143 | 42.002 | 34.450
90th | 26.738 | 53.704 | 44.964
95th | 34.337 | 66.108 | 55.452
99th | 53.328 | 100.045 | 85.139
3-nines | 94.580 | 167.428 | 148.197
4-nines | 167.318 | 382.972 | 361.199
5-nines | 370.126 | 468.161 | 468.161
6-nines | 370.126 | 468.161 | 468.161
7-nines | 370.126 | 468.161 | 468.161
8-nines | 370.126 | 468.161 | 468.161
9-nines | 370.126 | 468.161 | 468.161
max | 370.126 | 468.161 | 468.161
Command Line: diskspd.exe -c25G -b512K -w50 -Sh -d600 -L D:\testfile.dat
Input parameters:
timespan: 1
————-
duration: 600s
warm up time: 5s
cool down time: 0s
measuring latency
random seed: 0
path: ‘D:\testfile.dat’
think time: 0ms
burst size: 0
software cache disabled
hardware write cache disabled, writethrough on
performing mix test (read/write ratio: 50/50)
block size: 512KiB
using sequential I/O (stride: 512KiB)
number of outstanding I/O operations per thread: 2
threads per file: 1
using I/O Completion Ports
IO priority: normal
Results for timespan 1:
*******************************************************************************
actual test time: 600.00s
thread count: 1
proc count: 8
CPU | Usage | User | Kernel | Idle
——————————————-
0| 27.43%| 8.87%| 18.56%| 72.57%
1| 36.37%| 14.08%| 22.29%| 63.63%
2| 29.94%| 9.99%| 19.95%| 70.06%
3| 39.66%| 9.76%| 29.90%| 60.34%
4| 23.94%| 8.85%| 15.09%| 76.06%
5| 56.65%| 14.87%| 41.77%| 43.35%
6| 27.74%| 7.14%| 20.61%| 72.26%
7| 29.32%| 4.17%| 25.15%| 70.68%
——————————————-
avg.| 33.88%| 9.72%| 24.16%| 66.12%
Total IO
thread | bytes | I/Os | MiB/s | I/O per s | AvgLat | LatStdDev | file
—————————————————————————————————–
0 | 69124751360 | 131845 | 109.87 | 219.74 | 9.099 | 20.606 | D:\testfile.dat (25GiB)
—————————————————————————————————–
total: 69124751360 | 131845 | 109.87 | 219.74 | 9.099 | 20.606
Read IO
thread | bytes | I/Os | MiB/s | I/O per s | AvgLat | LatStdDev | file
—————————————————————————————————–
0 | 34584657920 | 65965 | 54.97 | 109.94 | 13.611 | 24.586 | D:\testfile.dat (25GiB)
—————————————————————————————————–
total: 34584657920 | 65965 | 54.97 | 109.94 | 13.611 | 24.586
Write IO
thread | bytes | I/Os | MiB/s | I/O per s | AvgLat | LatStdDev | file
—————————————————————————————————–
0 | 34540093440 | 65880 | 54.90 | 109.80 | 4.581 | 14.271 | D:\testfile.dat (25GiB)
—————————————————————————————————–
total: 34540093440 | 65880 | 54.90 | 109.80 | 4.581 | 14.271
total:
%-ile | Read (ms) | Write (ms) | Total (ms)
———————————————-
min | 0.466 | 0.437 | 0.437
25th | 1.995 | 0.584 | 0.701
50th | 6.506 | 0.725 | 2.066
75th | 13.976 | 2.269 | 9.971
90th | 30.622 | 10.937 | 21.618
95th | 50.217 | 19.840 | 36.896
99th | 129.307 | 62.694 | 103.474
3-nines | 251.222 | 186.690 | 234.561
4-nines | 374.508 | 294.005 | 353.957
5-nines | 420.817 | 357.480 | 395.550
6-nines | 420.817 | 357.480 | 420.817
7-nines | 420.817 | 357.480 | 420.817
8-nines | 420.817 | 357.480 | 420.817
9-nines | 420.817 | 357.480 | 420.817
max | 420.817 | 357.480 | 420.817
